The Breakout Strategy
Read our beginners’ guide to using the breakout strategy and learn how to include it in your trading plan.
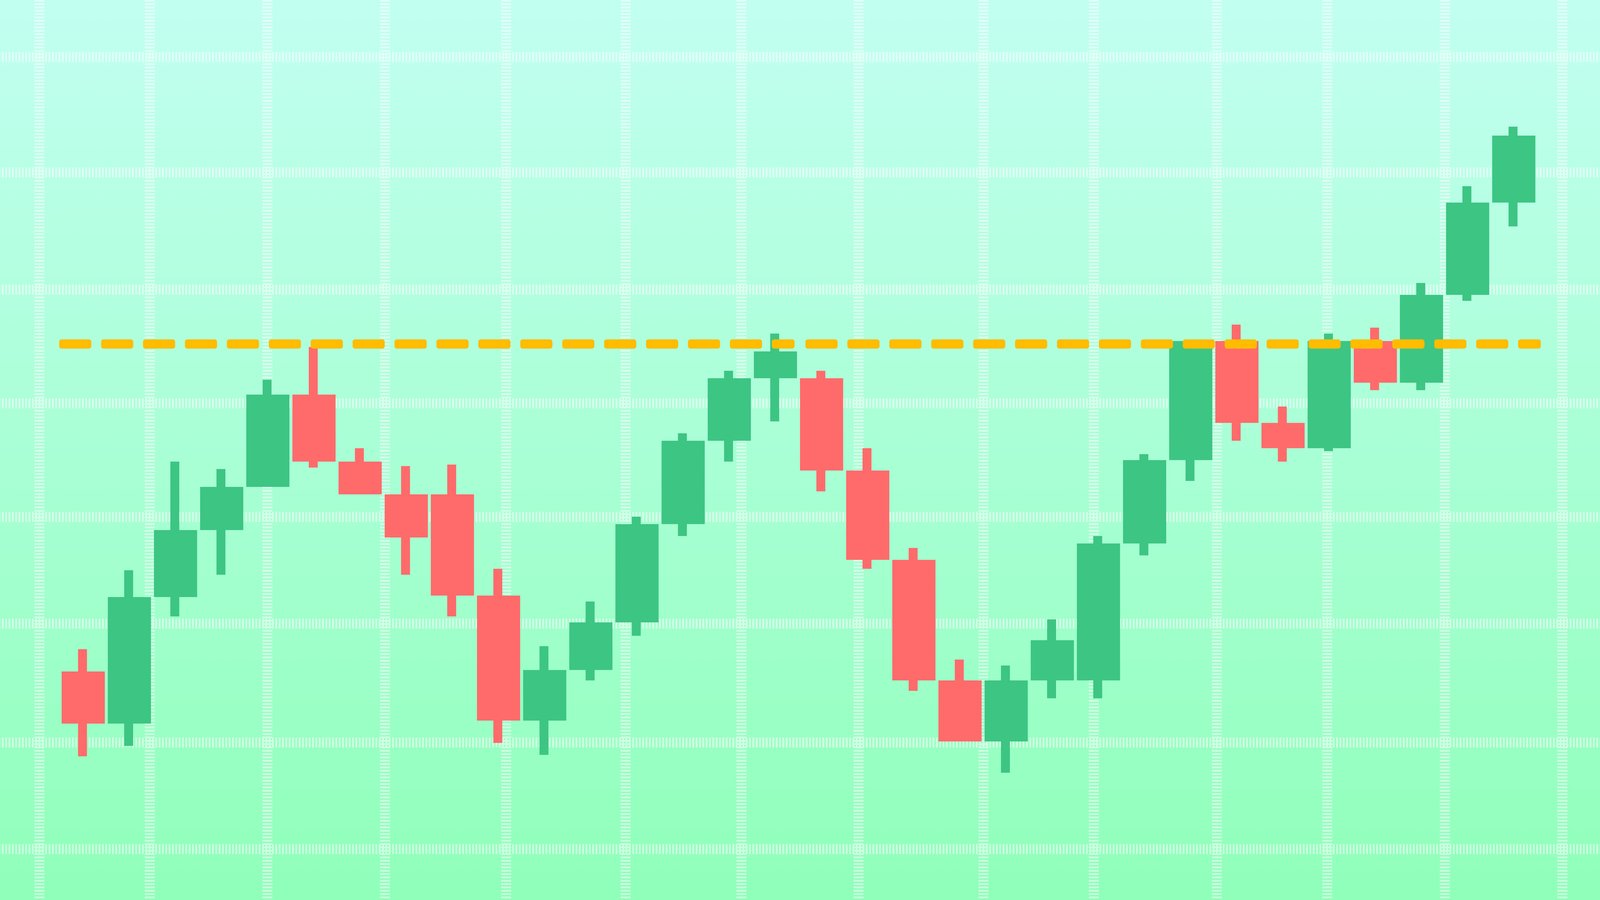
A breakout describes when the price of an asset moves outside of its determined trading range
The breakout strategy refers to identifying breakouts as soon as they happen and then opening a position in the market to profit from the trend early on
Breakout traders use technical analysis, with its tools and indicators, to analyse past price data and to spot the best time to enter the market
The breakout strategy can be used in online trading for all financial assets, such as shares and forex
False breakouts are the main risk of the strategy, but effective risk management can help limit the possibility of losses
What is the breakout strategy?
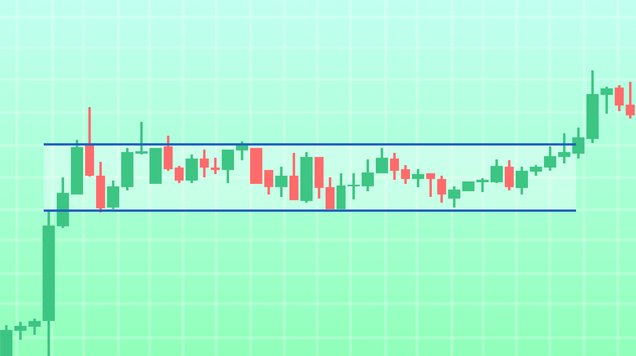
In trading terms, a breakout means that the price of a financial asset, such as a share, moves outside of its determined trading range, which is often indicated by its support and resistance levels. The breakout strategy focuses on identifying market trends as soon as they break and helps capture profits from the early stages of trends.
The idea behind trading breakouts is that when the price finally breaks out of the previous trading range, the price movement is expected to continue in the same direction which is profitable for traders who open positions early.
In CFD trading, traders can profit from both rising and falling prices. If the price breaks above the resistance level, traders will go long on a position hoping that the price will keep rising, whereas if the price drops below the support level, traders will go short hoping that the price will continue to fall.
A breakout strategy helps to identify price changes and trends, but can also indicate the start of significant market volatility and major price swings.
How do you start using the breakout strategy?
Once you have opened a trading account with a regulated online broker and chosen the assets you want to trade, you can start implementing the breakout strategy. Here’s how you can start:
1. Identify the current trend and trading range
The first step in trading breakouts is to look at the past price movements of the asset, identify the current price trend, and determine the trading range in which the price has been moving lately. This is often indicated by evaluating a market chart’s support and resistance levels.
A support level refers to the price point at which prices begin to rise again, this happens when there is more demand than supply which causes the buy momentum to increase. Opposingly, the resistance level indicates the price point at which prices will begin to fall at because there is more supply than demand, or in other words it indicates the highest level a price will reach within the current trend.
Support and resistance levels can be identified in different time periods such as daily, weekly, and monthly, but over a longer time, when more price data is used, their relevance increases. The more times the price of the asset has touched resistance or support levels on the chart, the more significant they become, and the more significant a breakout becomes.
2. Establish an entry point
After establishing the support and resistance levels, the next step is to plan the entry point for your strategy. Often, traders open a position when the asset’s price is about to close above the resistance level or below the support level.
Some traders choose to enter the market immediately when there is a move over the lines, while more moderate risk takers prefer to wait until the price closes outside the levels. Opening positions as early as possible can lead to bigger profits but there is also a higher risk of losing capital. It depends on how much risk you are ready to take.
3. Decide when to exit the market
While deciding on an entry point is relatively simple, choosing the ideal exit point can be a bit trickier. When predicting how high the prices will rise and when is the correct moment to sell for profit, it’s important to look at previous price behaviour to calculate a realistic exit price. It’s also important to remember that not all trades are profitable and to decide how much capital you are ready to lose if your strategy turns out to be unsuccessful.
You can monitor your open trade and close the position when you are happy with the outcome or place a take profit or stop loss order at a chosen level to close the trade automatically.
Technical analysis tools for breakout traders
Previous price data is at the heart of the strategy, so breakout traders usually rely to technical analysis and its toolbox to identify breakouts.
Support and resistance lines and their importance for trading breakouts has been explained earlier in this article, so here are introduced some other patterns and technical indicators that traders can use to detect significant price movements.
Price channels, trend channels and triangles are examples of chart patterns that can be used in establishing trading ranges and identifying breakouts. Both of these are formed by trendlines that connect the highest and lowest prices. To create a trendline, you should have at least two top or bottom prices that connect to each other. Price channels and triangles can be either ascending or descending depending on the current trend.
A head and shoulders chart pattern can also be applied to breakout trading, and is usually used by more experienced traders. The head and shoulders pattern is indicated by three price points that form a pattern on a chart similar to a silhouette of a head and shoulders. For breakout traders, it’s important to draw a neckline on the pattern based on the support and resistance levels.
An ichimoku cloud is another technical indicator which is used by breakout traders. The ichimoku cloud can seem complicated to understand in the beginning, but with experience it becomes easier to read. It’s formed by five different calculations or lines, and two of these lines form a cloud. Senkou Span A and B are the names of the lines that create the cloud formation and provide resistance and support levels. An ichimoku cloud can be paired with relative strength index (RSI) or other technical indicators as well.
Luckily, the tools and indicators introduced in this chapter can easily be added to charts on your online trading platform, so you don’t need to learn how to draw or calculate them yourself.
The benefits of trading breakouts
CFD traders have plenty of trading strategies to choose from so let’s take a look at some of the key benefits of the breakout strategy.
Possibility to maximise profits
Taking positions in the early stages of a trend allows traders to get the maximum benefit from a price movement.
Easy to combine with different trading styles
The breakout strategy can be used over any time period with many trading styles and strategies; including day trading, swing trading and other popular options.
Applicable to all assets
Trading breakouts can be applied to all financial assets, such as shares, indices, commodities, forex and cryptocurrencies.
Suitable for beginners
A breakout strategy is also suitable for traders with less experience as defining entry and exit points is relatively straightforward.
Spend less time monitoring the market
When you have identified the ideal entry point for a trade, you can place a pending order close to the resistance or support level and the position will be automatically opened if the price breaks out. Combining a breakout strategy with pending orders could help reduce your active time on markets.
False breakouts and risk management
False breakouts are the major risk for a breakout strategy. A false breakout means that the price breaks out of its trading range but doesn’t continue to move in the expected direction. In the case of a false breakout, the price usually moves quickly back to its range.
If the trader opens a position and the breakout turns out to be false, there is a possibility of losing some or all of the capital invested in the trade. It’s important to realise when it’s time to cut losses and close the trade before the sum accumulates.
One way to limit the risk of trading a false breakout is to wait and see if the price moves back to the previous price range by the end of the day, however this may mean losing the best time to capture opportunities as well. Sometimes the price opens outside the resistance or support levels, but has moved back when the market closes.
Using risk management strategies and tools will help you to prepare for the possible outcomes of your trades and limit losses. Stop loss orders, diversification and hedging are common ways to manage risk in trading and can be applied to the breakout strategy as well. In the case of breakout trading, the stop loss order is often placed a bit below the previous resistance level or bit above the previous support level.

